Making Cognition Visible in AI, UX, and Strategy
Most systems don’t fail because they lack data—they fail because no one knows how to see the big picture.
That’s where Visual Maps come in.
At Artifathom Labs, we create custom cognitive diagrams that show not just what’s happening—but how people think, decide, forget, and feel inside a system.
These aren’t just pretty charts. They’re grounded in cognitive neuroscience, behavioral anthropology, and UX flow theory.
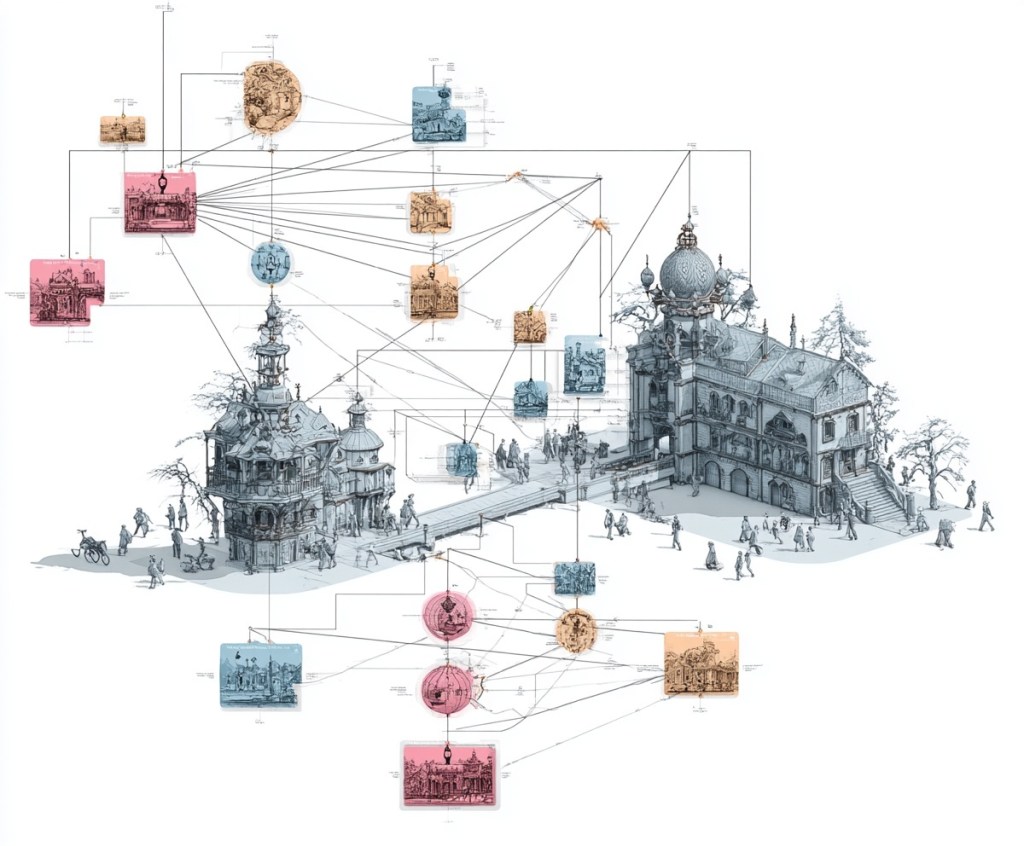
What Is a Visual Map?
A Visual Map is a layered blueprint that represents:
- Cognitive Load – Where users are overwhelmed or friction builds
- Attention Flow – How focus shifts across steps or content
- Memory Anchors – Where learning occurs, decays, or repeats
- Emotional Valence – Where trust is earned, anxiety spikes, or curiosity kicks in
- Tool/Interface Impact – How the system’s structure affects human behavior
Each map is tailored to the system you’re studying: a sales tool, a learning platform, a policy experience, or even a human-AI dialogue model.
Examples of Our Maps
We’ve built maps for:
- AI Tutors
Visualizing how learners shift between focus, fatigue, and feedback—so the system can respond dynamically - Enterprise Dashboards
Mapping where users drop off, misinterpret, or resist engagement—before rethinking the UX - Cold Storage Memory Systems
Layering memory decay curves over knowledge flow to make AI forgetting intentional and intelligent - Sales + Enablement Workflows
Mapping not just what reps do, but how they think at each stage—so tools coach, not just track
We combine visual grammar, behavioral tagging, and meaningful metaphors to help teams align across disciplines.
Why Visual Mapping Works
Visual maps work because your brain is wired for structure, not spreadsheets.
When people can see thinking patterns, they make better design decisions, smarter AI models, and more human-centric systems.
“You don’t just see the process—you see the soul of it.”
Want Your Own Map?
We co-create maps through 1:1 consulting, data session debriefs, or cognitive deep-dives.
Let us help you turn ambiguity into intelligent structure.
Call to Action
Interested in mapping your system’s behavior, memory, or UX flow?
Contact us to scope your own visual intelligence blueprint.
